
Here are the Real Effects of Loss Chasing
Hello, and welcome to part two of our four-part series on loss chasing. If you missed part one, we discussed the following:
- What is loss chasing?
- Why do people buy more of a losing position?
- Why it makes us feel better?
And for those who prefer the TL;DR approach, loss chasing describes the pattern of buying more shares after a price drop in the hopes of reducing the painful emotional impact of having an investment that is “underwater” by lowering their average cost.
Ultimately, making this choice is not based on technical, economic, or fundamental rationale, it’s a behavorial move. It makes us feel better because it initially reduces the pain of being in a losing position, and it also, on a very human level, gives us hope that the price will rebound.
You can read all about it here.
In this second part of our series, we’re going to do a deep dive into a case study. We’ll look over the effects of buying more of an asset when its price is less than what it was paid for (known as Average Cost Basis, or ACB).
Ready to see the consequences of a reaction to losses for a specific investor? Great, let’s go.
Is This Investor Buying Losing Assets?
For this part of the series, we’ve brought in some visual help. In the graph below, you can see the returns of our investor friend, let’s call him Bob. And for those who like a clear mental image, Bob likes lager beers, has a cat named Felix, and enjoys vampire movies.
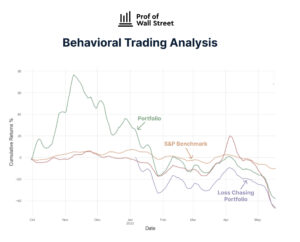
Looking at his behavioral trading and performance graph below, we can see that after a big run-up in his portfolio (green line), the assets decline rapidly in value starting in November 2021. This is known as a drawdown.
And in Bob’s particular case, this drawdown is the crucial moment that he needed to be aware of the impact of being in loss positions. He also should have had a clear plan in advance rather than allowing his emotional reactions to guide his investment decisions.
And the following is why.
You’ll notice the reaction to losses appears clearly: We see that around January 2022 he began to buy more of the losing positions.
This is what makes this case interesting in the first place, we can readily see the portfolio drop in value and in response to that decline, our investor starts buying more of the same assets as they fall in price.
To better understand his performance, we’ll compare his returns to what’s called a “benchmark”.
In this case, the Standard & Poor (S&P) index is used as the benchmark as it contains the largest 500 US stocks by market capitalization and Bob’s specific stocks belong to this index (orange line).
You can see that the benchmark is dramatically more stable over time and does not experience the same large movements as Bob’s portfolio.
The S&P is a popular investment vehicle because it is a highly diversified investment available as a low-fee Exchange Traded Fund (ETF) from multiple financial firms (e.g., Vanguard).
Let’s now see a deeper analysis of our investor’s portfolio and how even small purchases can affect his overall performance.
Is This Helping Or Hurting Our Investor?
To isolate the impact of buying stocks in losing positions, I wrote an algorithm that reads the entire trade history and creates a “sub-portfolio” consisting exclusively of assets purchased below their average cost basis.
This takes out all the noise and allowwed me to zero in on the objective performance of this strategy. It let me determine whether it creates or destroys value for our particular investor at this particular time under evaluation.
Recall that Bob’s portfolio (green line) initially significantly outperformed the S&P benchmark (orange line). Yet as his portfolio started to drop in value, he started buying more of their losing positions and began forming his loss chasing portfolio in January 2022 (purple line).
Again, the loss-chasing portfolio contains only stocks that he bought in losing positions. We can see this is the worst performing.
Looking closer, you’ll notice that eventually, the portfolio itself approximates the poor and negative performance of the loss chasing portfolio and drops below the S&P benchmark. This suggests that loss -chasing behavior has a negative impact on returns and needs to be addressed.
Now, let’s look at the performance statistics in the table below.
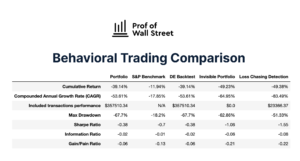
Notice that it confirms a pattern of buying more shares in losing positions. Specifically, the right-most column, Loss Chasing Detection, shows the worst performance across the key metrics (e.g., Cumulative Return, Sharpe Ratio).
The number of buy transactions that are loss-chasing accounts for only 6.5% of trade volume. Yet the performance of this “sub-portfolio” is -49% and partially responsible for dragging down the portfolio.
Now, are you ready for the mic drop?
While Bob thinks he’s positively contributing to his portfolio, his Loss Chasing Detection is negative and he is actually destroying value.
So what could help our investor friend in this situation? Well, if only he could determine the psychological motivations behind his purchases, maybe he wouldn’t have destroyed his portfolio value.
Ready to learn more?
Join us in part three of our four-part series, and we’ll talk about psychological motivations, the neuroscience behind it all, and the emotional and financial impacts of loss chasing.