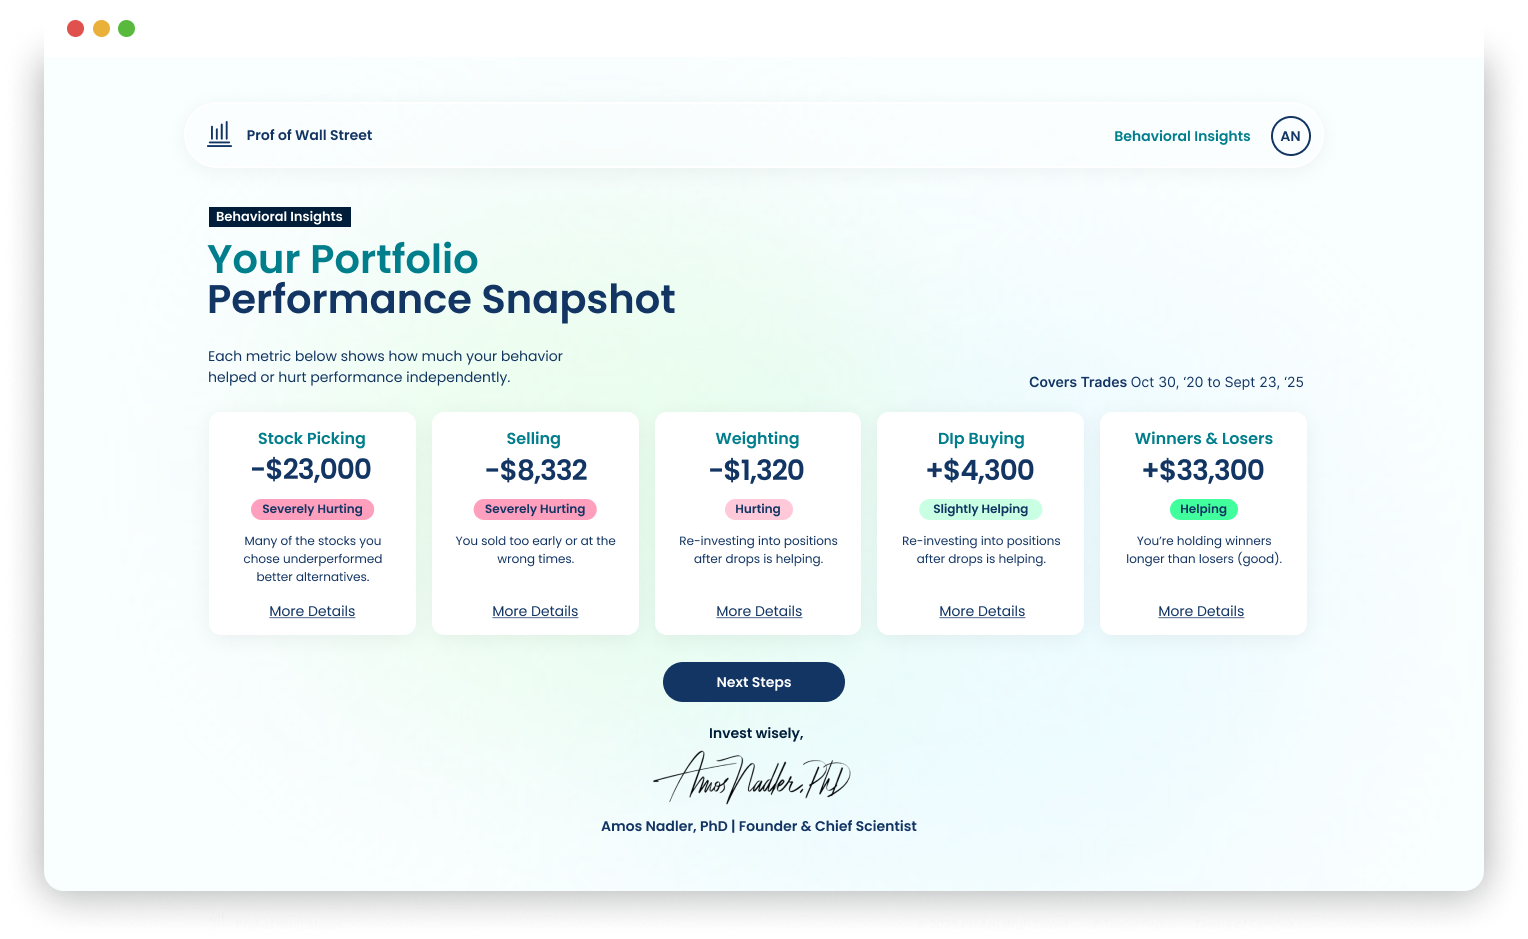
Powerful Behavioral Insights
Take the first step to mastering investing (free for a limited time).
Stock Picking
Is your conviction paying off or costing you?
Research shows asset selection drives portfolio performance. We don't only tell you that your stock selection added value overall—we also isolate the 3-5 best and worst decisions that created the most behavioral drag on your portfolio. This shows the clear dollar cost of that one 'sure thing' that went sideways.
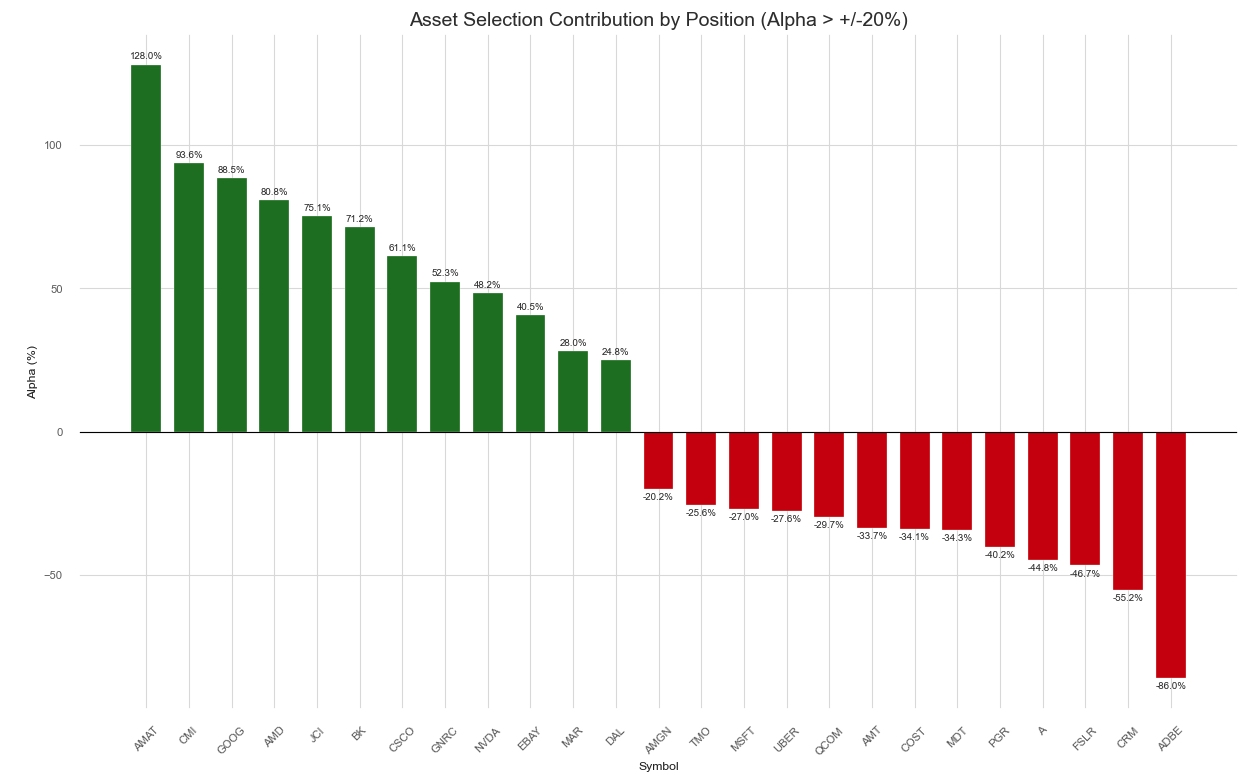
See the most meaningful difference between S&P performance and individual stocks above and below a 20% difference from the benchmark.
Selling
How much wealth did you accidentally leave behind?
When you sell a position, it vanishes—and sometimes, your wealth invisibly goes with it. Our analysis reveals your 'Invisible Portfolio' in dollar terms, quantifying exactly how many times you were wrong—or right—after you sold.
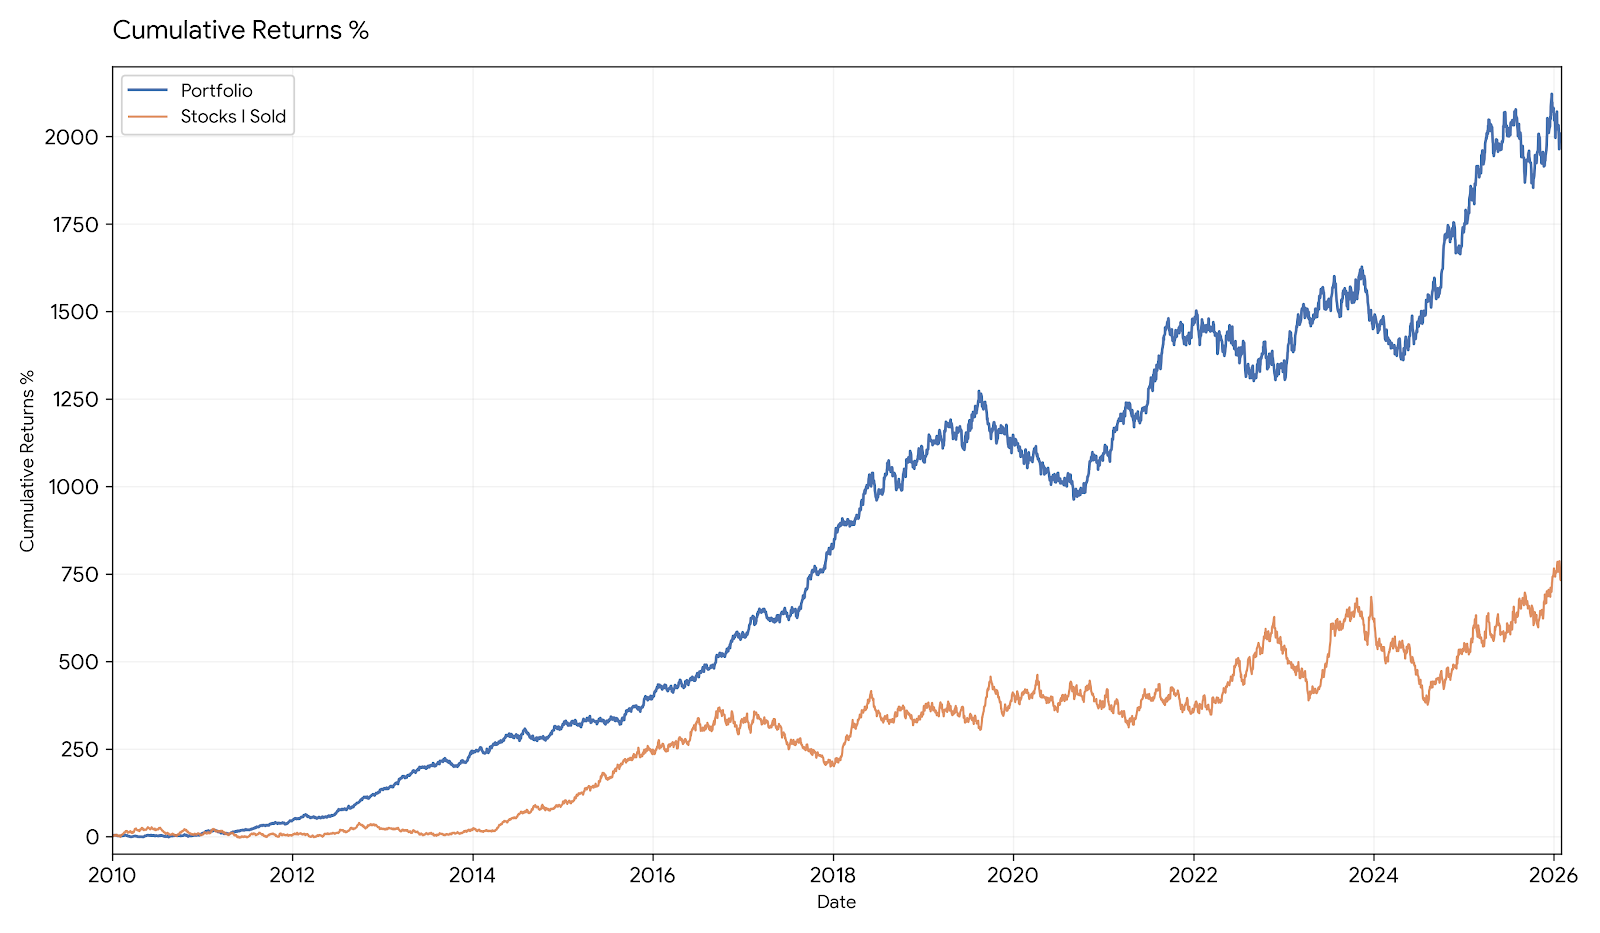
This graph shows the relative performance of the portfolio (blue line) and sold asset (orange line; known as the “invisible portfolio” because performance cannot be easily seen or tracked post-sale).
Weighting
Are your best ideas sabotaged with poor sizing?
You pick a winner, but did you put enough capital behind it? We separate your great stock-picking skill from position-sizing drag. You’ll see exactly how much potential return was leaked where you under-invested in a high-conviction winner or over-invested in a losing asset.
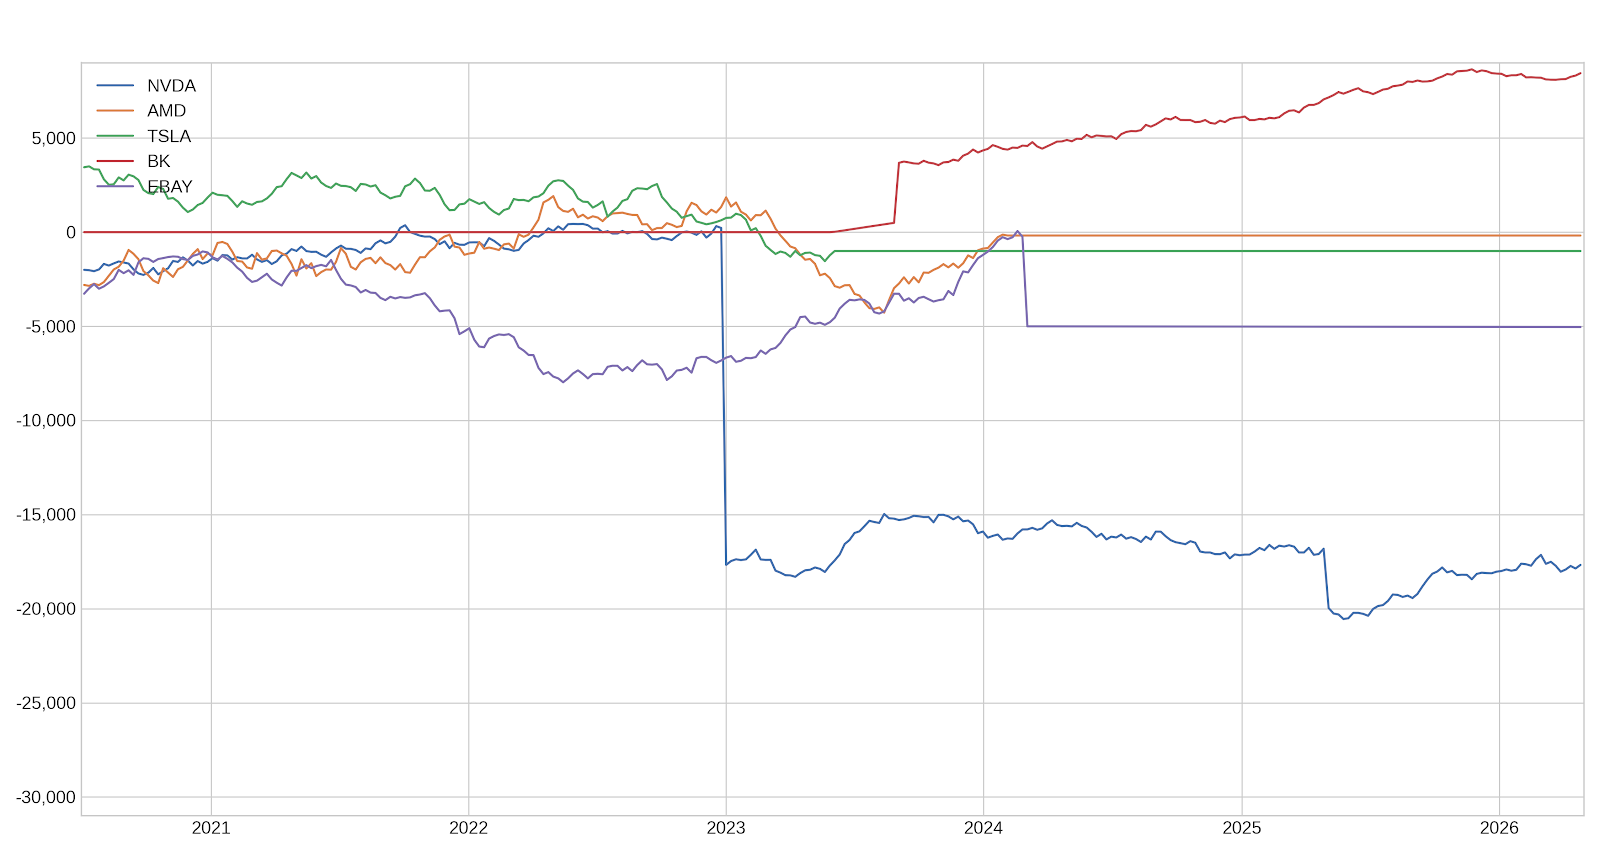
This chart shows the top five stocks with the biggest weighting impacts on the portfolio.
Dip Buying
Profitable dip buying or costly loss chasing?
You might be a disciplined dip buyer, but without data you might miss a behavioral trap: loss chasing. We quantify the dollar value of your dip buys and compare them against your overall returns to show, once and for all, if this strategy is an alpha-generating strength or a costly emotional reaction.
.png)
See the relative performance of your portfolio (blue) and dip buying “subportfolio” (orange).
Winners & Losers
The Disposition Effect: See the exact dollar cost of your regret.
This is the most direct look at the money you left on the table. The Disposition Effect is the tendency to sell winners too soon and hold losers too long. Our report gives you a direct, quantified ‘what-if’ analysis showing the dollar amount you would have made if you consistently held your winners longer and cut your losers faster.
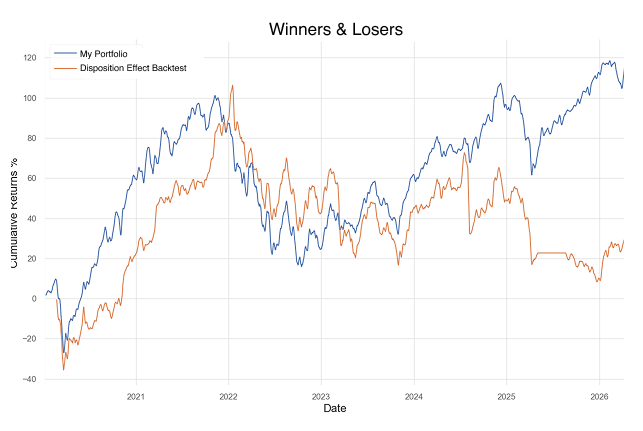
This graph gives you the “what if” analysis if you sold your winners later and losers faster (orange line) relative to the historical decisions in the portfolio (blue line).